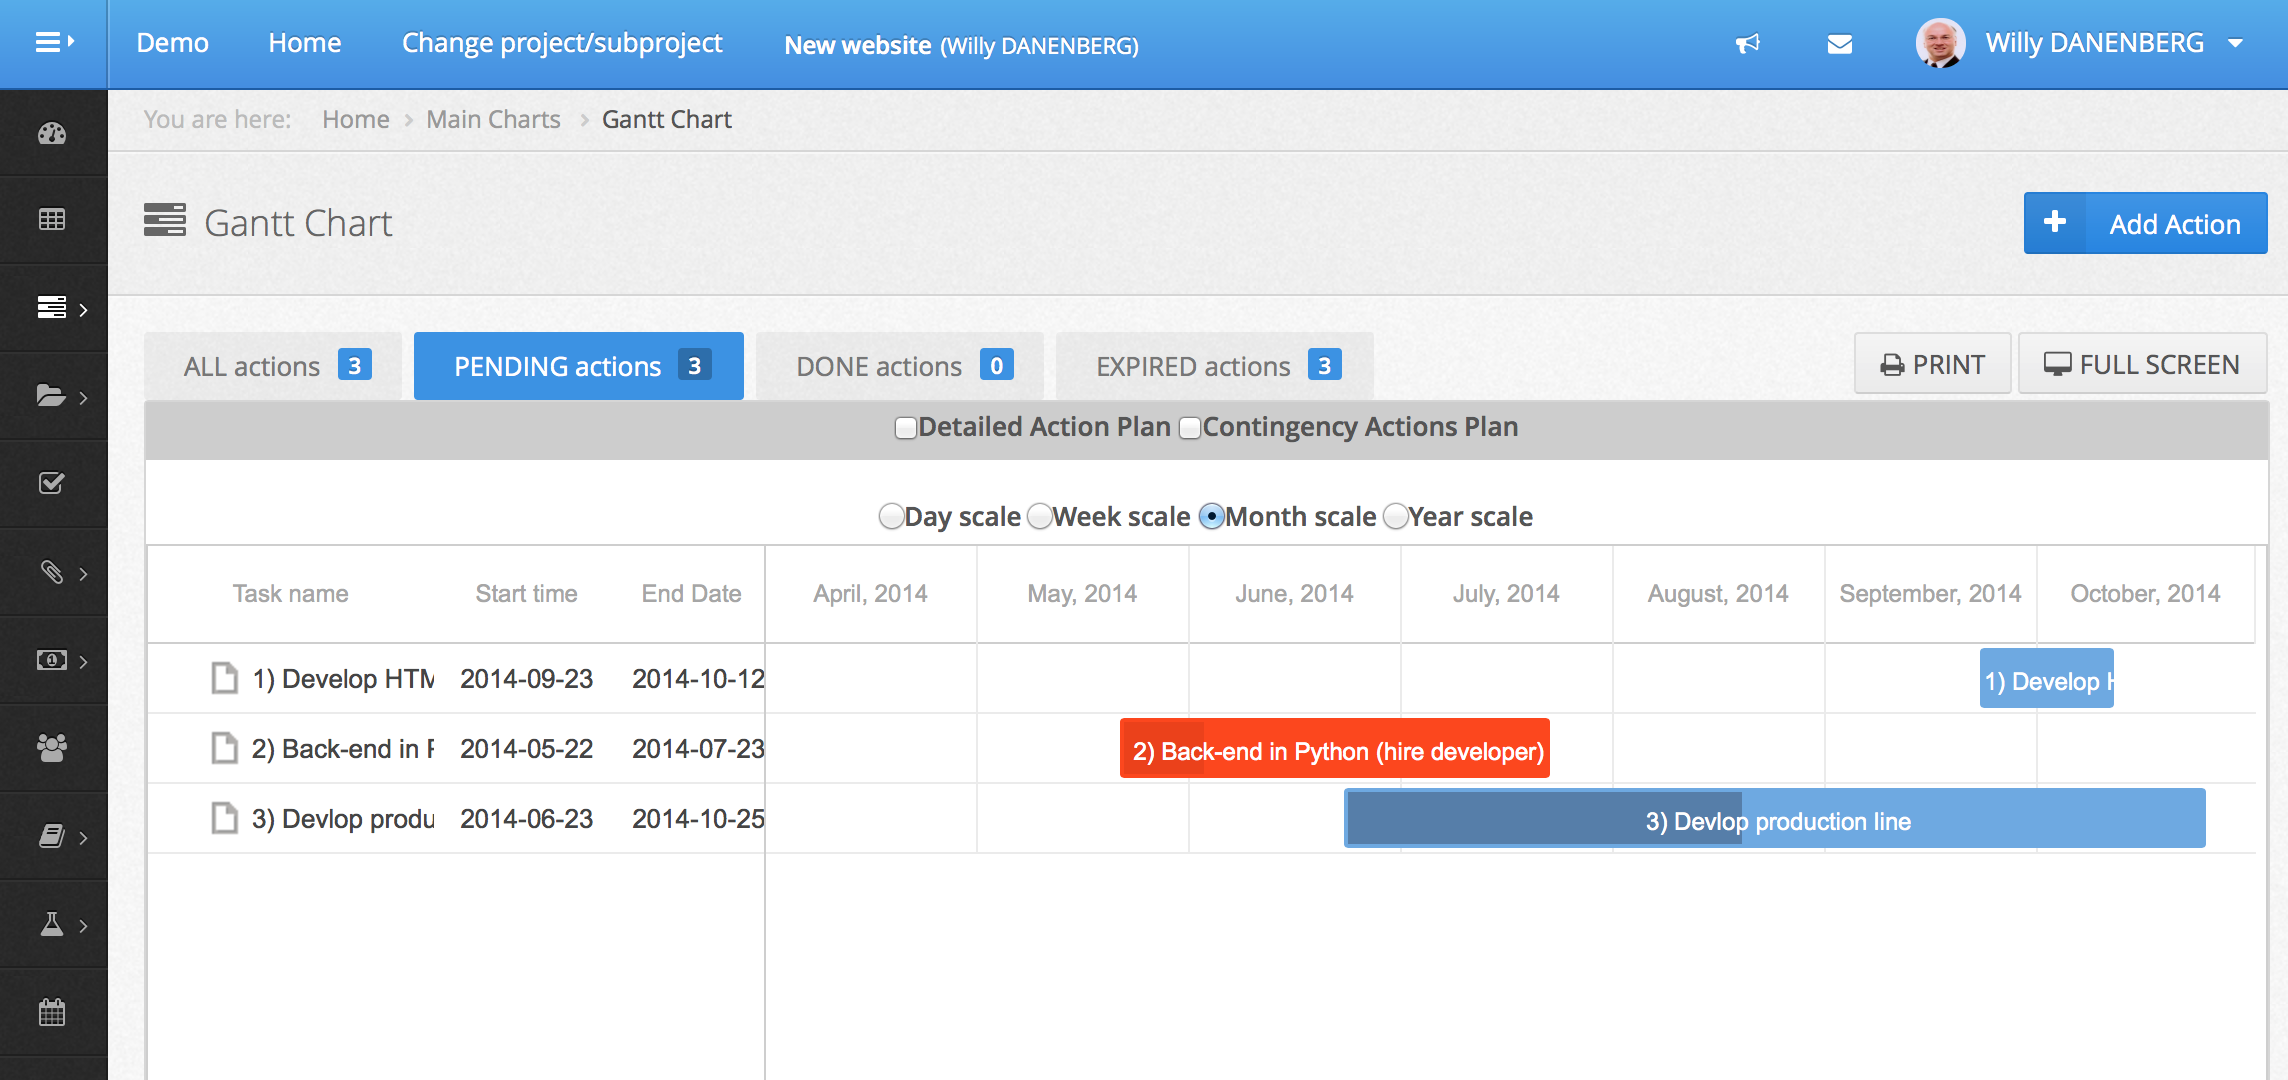
AltoChange Gantt chart is a type of bar chart, developed by Henry Gantt in the 1910s, that illustrates a project schedule. Gantt charts illustrate the start and finish dates of the terminal elements and summary elements of actions and of the project.
Various Gantt Chart elements comprise the work breakdown structure of the project. AltoChange also show the dependency relationships between activities. AltoChange Gantt charts can be used to show current schedule status using percent-complete shadings.
Gantt charts were considered extremely revolutionary when first introduced and today are used in most project management systems and enable the planning and visual representations that are easy to understand.
This chart is also used in information technology to represent data that have been collected.
Features
Contact Us
We often send our specialists all over the world to solve any project, or team management issues. We are here to help you!
You can get a skype demo of our software.
2019 © AltoChange Consulting. ALL Rights Reserved. Privacy Policy | Terms of Service